Overview
When debugging a crash in Unreal Engine using Rider or Visual Studio, you might run into a screen filled with low-level assembly code instead of your C++ source. This usually happens when debug symbols are missing. it’s easy to fix.
Environment
- Engine: Unreal Engine 5.x
- IDE: JetBrains Rider or Microsoft Visual Studio (Windows)
Main Content
If your debugger shows only raw assembly like this:
mov eax, dword ptr [rax+10h]
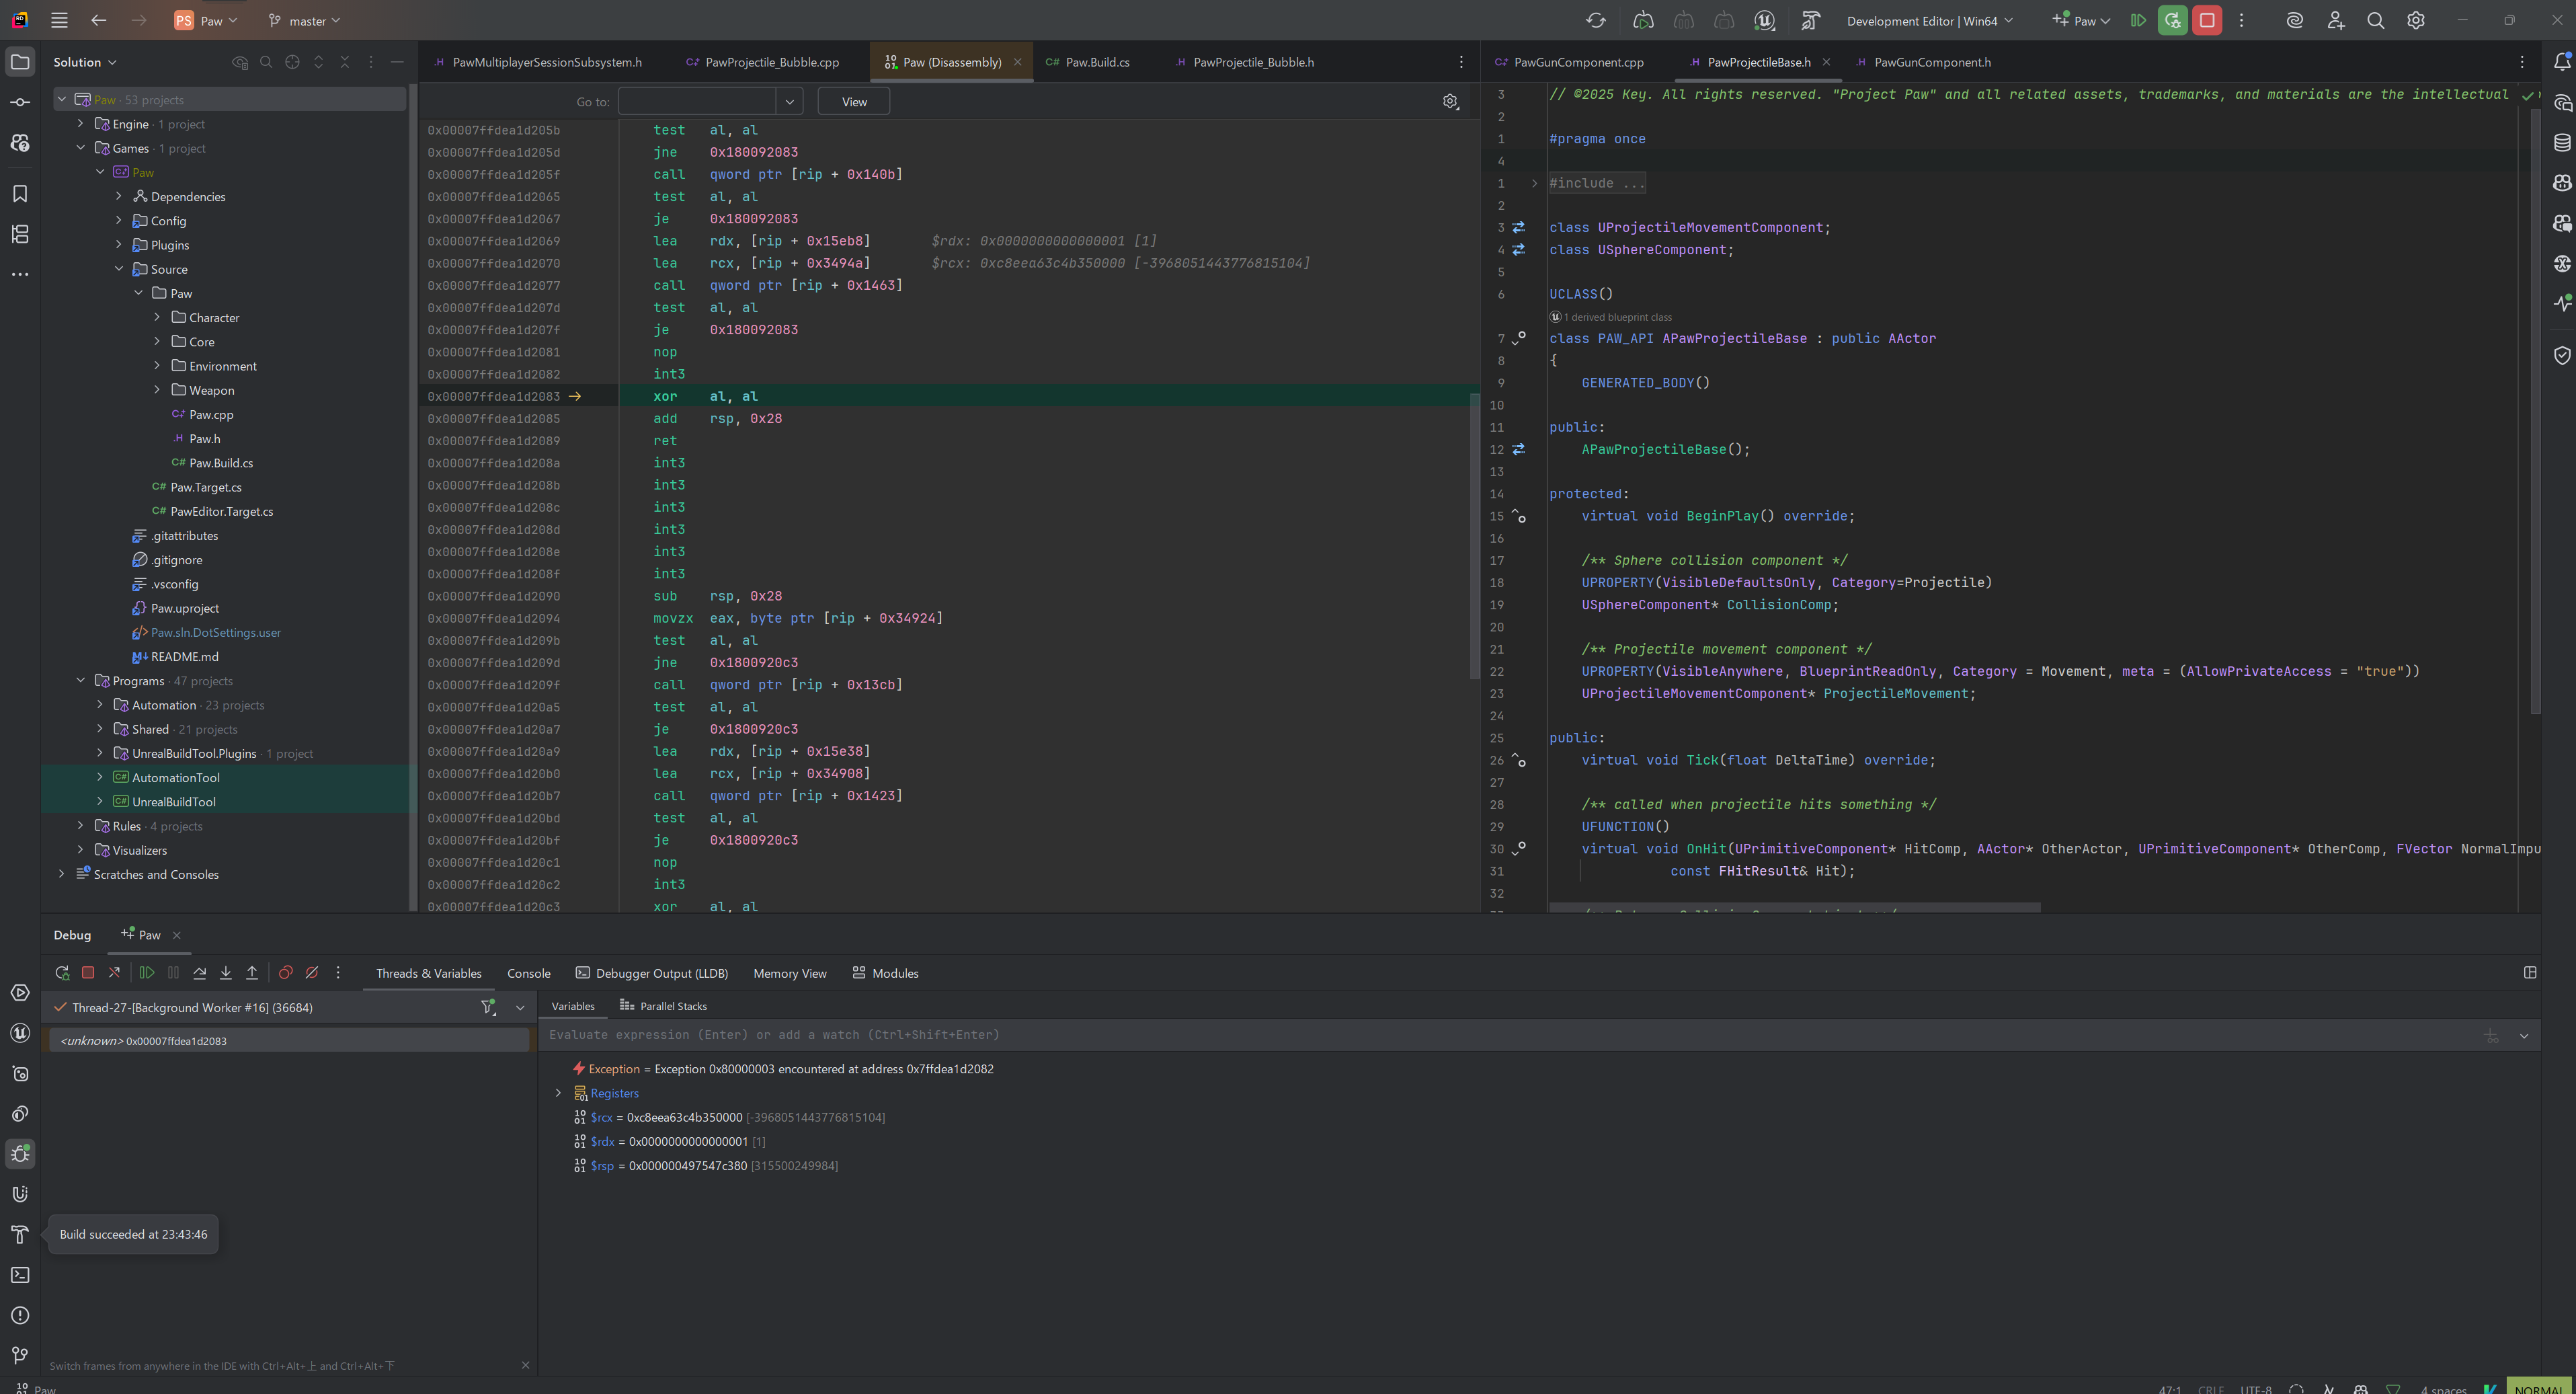
It means it can’t find the symbol files (.pdb). These are essential for mapping compiled code back to your C++ source.
✅ How to Fix It
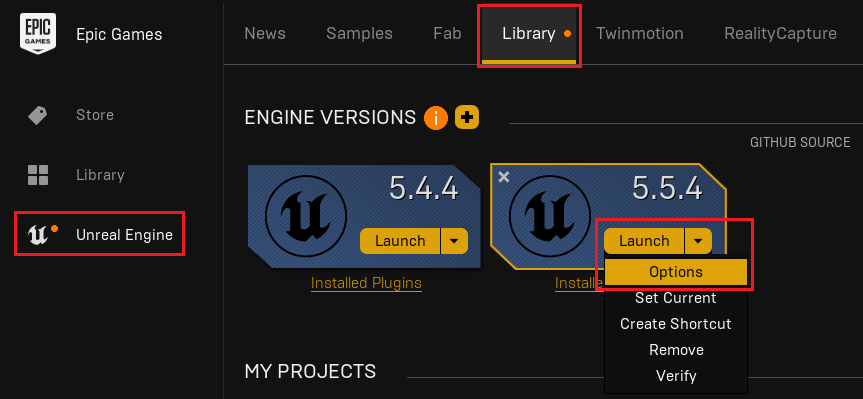
- Open Epic Games Launcher
- Go to the Library tab
- Find your installed UE version
- Click the ▼ arrow next to the Launch button
- Click Options
- Enable Editor symbols for debugging
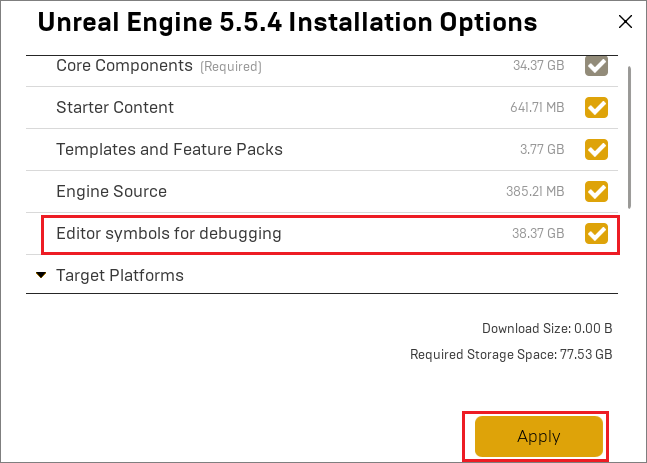
- Click Apply to download them (may take time — it's large)
This will install the debug symbols needed for proper source-level debugging.
Result
After installing the symbols:
- Rider or Visual Studio will now show C++ source lines and call stacks
- You’ll be able to trace crashes or runtime issues back to your own code
💡 Tip: When installing a new version of Unreal Engine, the debug symbols setting is disabled by default.
Make sure to turn it back on before debugging!